Graphical
HeatMaps are a
very powerful data visualization style to verify a model against an
intended design. It includes heat flows, heat dissipations,
as
well as temperature information to validate the model. The
major
heat flow paths can be easily visualized as well as any unintended or
unexpected connections. Layouts can be saved and applied to
updated model results and the display can be tailored to display linear
an/or radiative paths.
COVeRTM
Graphical HeatMap
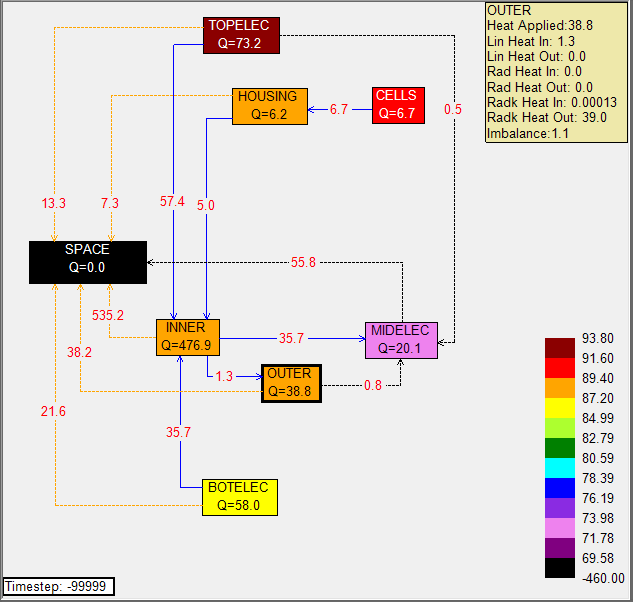
Up to six Canvases are available (Major, Minor, Sub, Sub2,
Sub3, and Submodel)
GroupBoxes are placed on the Canvas
- These can show Dissipation, Temperature or Heat
Imbalance
- ColorBar allows for Temperature Display while
text shows Dissipation
Connectors between GroupBoxes Indicate Heat Flow and
Direction
- Connectors can be expanded (L to S) or
collapsed (L to I) but always stay connected to boxes
- Control over Color and Linestyle
- Control over Text Location
- Text may display Heat Flow (Total, Linear, or
Radiative) or Conductance (Linear or Radiative)
ColorBar can be user customized
- Smart design includes two minimum temperatures
(Space is typically much colder)
Selecting new timestep in Plot Data Grid updates the display
ToolTip in Top Right to show summary for selected object
Timestep indicated in Bottom Left
Layouts can be saved and loaded to apply to updated results
sets