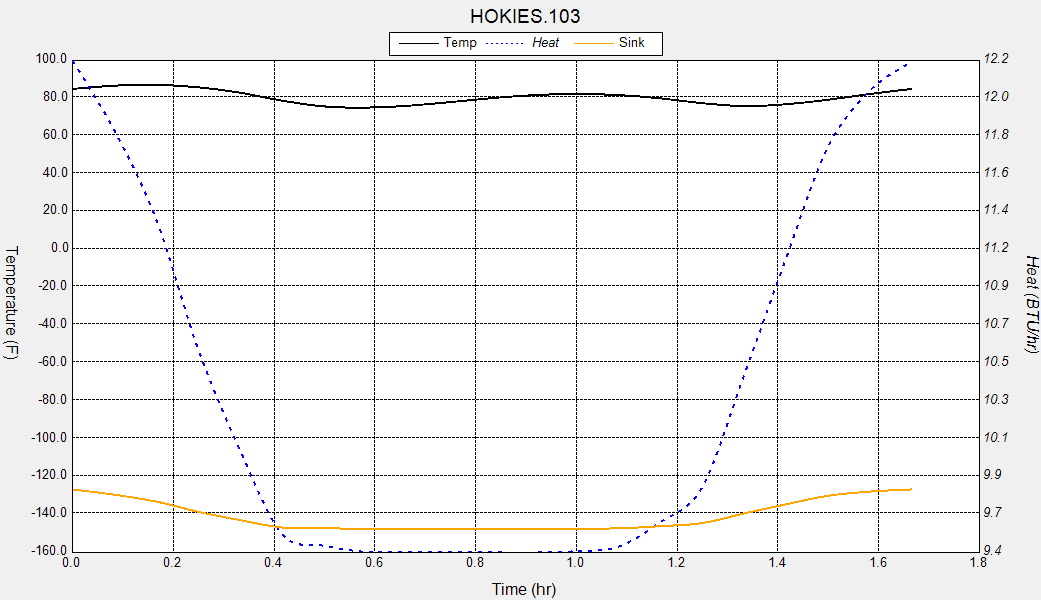
COVeRTM Plotting allows the user to display transient
data as an XY Plot. The data may include nodal or group
values as well as heat flows.
COVeRTM
Plotting
The following data may be plotted for Groups or Nodes:
- Temperature
- Max and Min Temperature (Groups Only)
- Heat Load
- Capacitance
- Environmental Heat
- Sink Temperature
- Backload
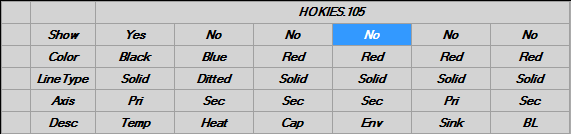
Plot Display properties are controlled by the Plot Data Grid
- Visibility
- Linestyle
- Color
- Axis
Specialized plot for Connectors which shows Heat Flow and
Temperatures at each end
XY Value at cursor or Slope between points displayed in
StatusBar