T
hermal
A
nalysis
R
esults
P
rocessor
Post-processing...Yeah, we've got that covered
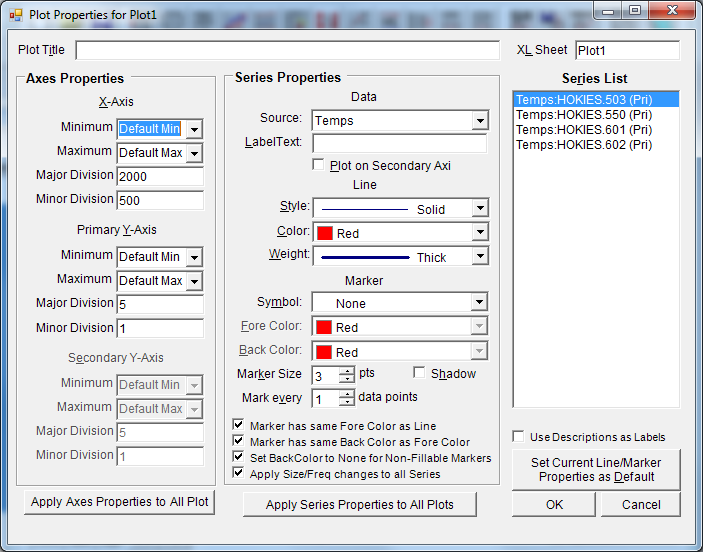
The Plot Properties form allows the user to specify Axes values and Series Properties for the Plot.
TARP
TM
Plot
Control X-Axis, Y-Axis, and Secondary Y-Axis properties:
-Minimum
-Maximum
-Autoscaling Implemented for Default Max/Min
-Major Division
-Minor Division
Control Source Data
Control Line Properties:
-LineType
-Color
-Weight
Control Marker Properties:
-ForeColor
-BackColor
-MarkerType
-Size
-Shadow
-Frequency
Apply formats to all Plots
Click Here to see Plot Output
Home
Post Processing
TARP
TM
Main Interface
DataSets
Groups
Parameters
Plots
StripCharts
Tables
StaticHeatMaps
HeatMaps
TARP
TM
Pro
GraphicalTables
RadkManipulations
RadkCompares
Backloads/Sinks
BinaryHeatMaps
COVeR
TM
Data Processing
Main Interface
Plotting
GraphicalHeatMaps
Pricing
Downloads
Contact Us
Site Map
Terms and Conditions
Copyright 2014
Thermal Modeling Solutions, LLC